Complex data normalization.
Sometimes the data normalization is not such an obvious procedure as the one outlined in the preceding paragraph.
What to do, for example, if you have a complex of two or more molecules, say a protein-DNA complex? The problem here is that you don't know which concentration and number of residues should you refer to for the normalization.
The answer is somehow unexpected: providing you have the spectrum of each component of the complex, you will not need any preliminar normalization! You will discover why in the complex data analysis paragraph.
Spectra deconvolution analysis.
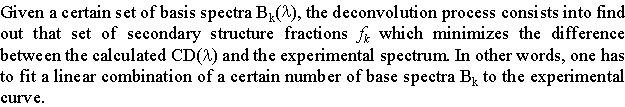
To obtain structural information from a CD spectrum, one needs to compare it quantitatively to a certain number of reference spectra. The process of reduction of an experimental CD spectrum to a combination of component spectra is called spectrum deconvolution.
To show how it works, we will consider the deconvolution of a protein CD spectrum to a sum of contributions.
First of all, we will assume that:
a) contributions of individual secondary structural elements to the overall CD spectrum are additive, and the effects of tertiary structure on the far-UV CD spectrum are usually negligible;
b) peptide chromophores are by far the most important elements for determining the far-UV CD spectrum (except in those proteins where a large number of aromatic aminoacids is present);
c) each structural element (alpha, beta, ...) can be described by a single CD spectrum, being the effect of geometric variability of secondary structural elements negligible.
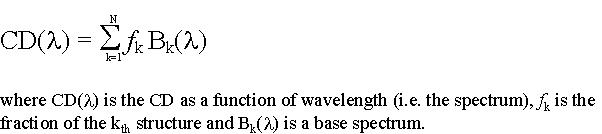
From these statements, you can assess that the far-UV CD spectrum of a protein can be view as a linear combination of N basis spectra, each of them corresponding to the spectrum of a given secondary structure element (100% helix, etc). We can thus write:
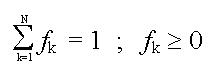
Moreover, it is obvious that:
![]()
![]()