Introduction.
Consider the case of the binding of a ligand to a protein.
In particular, think of a ligand that does not contribute to the CD spectrum in the region under analysis (for example, a metallic ion).
To obtain some useful information from CD data, like stoichiometry and Kd of the process, we must first of all assume that there is a direct dependence between the CD variation (i.e. the observed conformational change of the protein) and the completeness of the process under study (i.e. the amount of formed complex). This is a quite safe assumption, that is not only used in CD spectroscopy, but in all kind of techniques that monitor indirectly the ligand binding (UV-Vis, Fluorescence, I.R. ... ).
In
a simple bimolecular complex formation, the CD normalised variation is equal to
the fractional saturation of the acceptor.
During
a CD titration, one follows the CD signal at different concentration of added
ligand.
The
difference between what one should observe in absence of any interaction and
what one actually observe is called DCD
and is generally assumed to be directly proportional to the amount of formed
complex, so that:
1.
DCD = k[AB]
For [AB]= 0, DCD= 0; for [AB]=[Atot],
DCD
= DCDmax.
Let us consider a quantity called fractional saturation of sites, defined as:
2.
![]()
If we are in the simple situation of a 1:1 complex between an acceptor A (your RNA) and a ligand B (the protein), then this becomes obviously:
3.
![]()
where
[AB] is the concentration of complex and [Atot] is the
total concentration of RNA.
Now,
by substitution of eq. 1. into eq. 3. we get:
4.
![]()
That is, the fractional saturation of sites is (in the simple case considered here) equal to the normalised CD variation.
In
a simple bimolecular complex formation, the fractional saturation of the
acceptor is a function of the total concentration of added ligand and of KD.
Let us consider our simple complex formation as:
5.
![]()
We
will consider A as the acceptor molecule at a fixed concentration, B
as the ligand added during a titration.
From eq. 3., with very easy steps, we get:
6a.
![]()
6b.
![]()
6c.
![]()
Please note the different form of 6b. with respect to 6a. This is because [Btot] is a variable in our titration experiment, so that the equation 6a. cannot hold for the ligand B.
Now:
![]()
![]()
![]()
![]()
and,
reordering in frAB we have:
![]()
The
roots of this simple square polynomial are:
![]()
By
definition, it has to be always true that frAB £
1; however, because for example for [Atot] = [Btot]
we have:
![]()
then we are left with the only solution:
7.
![]()
By substitution of eq. 4. into eq. 7. we finally have:
8.
![]()
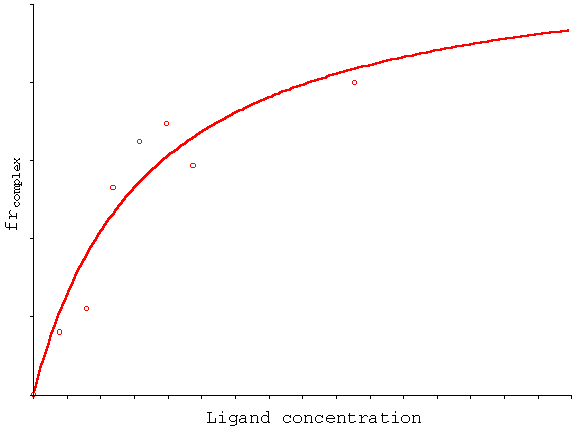
We can now build a graph reporting either frDCD or frAB (= frcomplex in the following example) versus the total ligand concentration:

In the particular case illustrated by the graph, the curve which best fits the data is a hyperbola, so that a simple binding model with one or more identical binding sites can be assumed. However, in a different experimental situation this can change. The shape of the curve you obtain is informative on the binding process; however, here I will not discuss further how to interpret the binding data (this is a circular dichroism tutorial after all!).
What is important to outline is that by CD you obtain simultaneously information on the binding equilibrium (Kd, stoichiometry) and on the structural effect of the ligand on your macromolecule. For example, in the above curve the binding of the ligand increases the intensity of the 222 nm band of a peptide, so that by CD you can view that the ligand binding is coupled to an increase of the helical content of the peptide.